Observability Architecture for Rust Services Explained
Logs, metrics and traces answer different questions. Wire them together with tracing and OpenTelemetry in a Rust service: one instrumentation API, a collector, context propagation across services and sensible sampling.
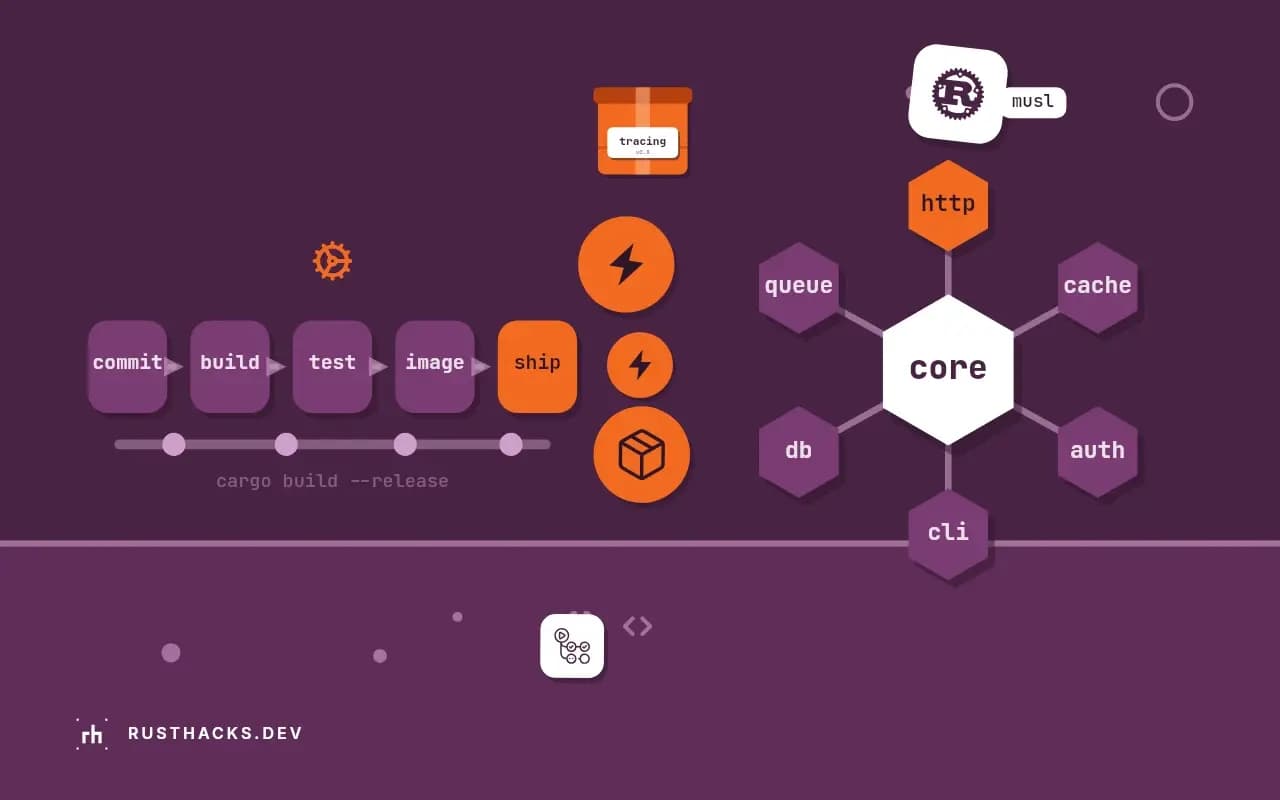
"Observability" is a heavy word for a simple goal: when something goes wrong in production, be able to find out what and why without deploying new code to look. Three kinds of data serve that, and the architecture question is how to produce them cheaply and consistently across services. This post lays out a design for Rust services that keeps instrumentation in one place and the backend choice open. Versions: Rust 1.90 with edition 2024, tracing 0.1, tracing-subscriber 0.3, tracing-opentelemetry 0.31, opentelemetry 0.30, opentelemetry-otlp 0.30; OpenTelemetry crates change often, so check the versions that match each other.
What each signal answers
| Signal | Question | Shape | Cost driver |
|---|---|---|---|
| Metrics | Is something wrong? How bad? Trends? | Numbers over time, aggregated | Number of distinct label combinations |
| Traces | Where in the call chain is the time or the error? | Tree of spans per request across services | Volume of requests sampled |
| Logs | What exactly happened in this case? | Timestamped events with fields | Bytes written and retained |
An alert fires from a metric (error rate up), a trace shows the slow downstream call, and the logs on that trace id show the failing input. The signals are useful because they link, and the link is the trace id.
One instrumentation API
use tracing::{info, instrument, warn};

#[instrument(skip(db), fields(order_id = %order_id))]
pub async fn charge_order(db: &sqlx::PgPool, order_id: i64, amount_cents: i64) -> Result<(), String> {
    info!(amount_cents, "charging");
    let balance = fetch_balance(db, order_id).await?;
    if balance < amount_cents {
        warn!(balance, "insufficient funds");
        return Err("insufficient funds".into());
    }
    Ok(())
}

#[instrument(skip(_db))]
async fn fetch_balance(_db: &sqlx::PgPool, _order_id: i64) -> Result<i64, String> {
    Ok(10_000)
}
#[instrument] creates a span per call, with function arguments as fields (skip the ones that are large or sensitive, logging without leaking secrets). Events inside inherit the span's context, so logs carry the order id without repeating it. Business code depends only on tracing; which exporters receive the data is decided at startup.
Wiring to OpenTelemetry
use opentelemetry::{global, trace::TracerProvider as _};
use opentelemetry_otlp::WithExportConfig;
use opentelemetry_sdk::{trace::SdkTracerProvider, Resource};
use tracing_subscriber::{layer::SubscriberExt, util::SubscriberInitExt, EnvFilter};

pub fn init_telemetry(service_name: &'static str) -> SdkTracerProvider {
    let exporter = opentelemetry_otlp::SpanExporter::builder()
        .with_tonic()
        .with_endpoint(std::env::var("OTEL_EXPORTER_OTLP_ENDPOINT").unwrap_or_else(|_| "http://localhost:4317".into()))
        .build()
        .expect("otlp exporter");

    let provider = SdkTracerProvider::builder()
        .with_batch_exporter(exporter)
        .with_resource(Resource::builder().with_service_name(service_name).build())
        .build();
    let tracer = provider.tracer(service_name);
    global::set_tracer_provider(provider.clone());

    tracing_subscriber::registry()
        .with(EnvFilter::try_from_default_env().unwrap_or_else(|_| EnvFilter::new("info")))
        .with(tracing_subscriber::fmt::layer().json())          // logs to stdout as JSON
        .with(tracing_opentelemetry::layer().with_tracer(tracer)) // spans to OTLP
        .init();
    provider
}
Two outputs from one source: spans go to an OTLP endpoint, and events go to stdout as JSON for the platform's log collector, with the trace id attached when you include it in the format. Call provider.shutdown() at exit so buffered spans flush (graceful shutdown). The exact builder API differs between SDK versions; treat this as the shape.
The collector in the middle
service A --OTLP-->                      --> traces: Tempo / Jaeger / vendor
service B --OTLP-->  OpenTelemetry  --> metrics: Prometheus / vendor
service C --OTLP-->    Collector     --> logs: Loki / Elasticsearch / vendor
Services send to a collector (an agent on each node or a shared gateway) instead of directly to a vendor. The collector batches, retries, filters, redacts attributes, samples and fans out to one or several backends. Switching backends or adding one becomes a collector configuration change with no redeploy of services. Keep the export asynchronous and bounded: telemetry must never block or crash request handling, and when the collector is down the SDK should drop data, not buffer without limit.
Propagating context across services
use opentelemetry::{global, propagation::Injector};
use tracing_opentelemetry::OpenTelemetrySpanExt;

struct HeaderInjector<'a>(&'a mut reqwest::header::HeaderMap);

impl Injector for HeaderInjector<'_> {
    fn set(&mut self, key: &str, value: String) {
        if let (Ok(k), Ok(v)) = (
            reqwest::header::HeaderName::from_bytes(key.as_bytes()),
            reqwest::header::HeaderValue::from_str(&value),
        ) {
            self.0.insert(k, v);
        }
    }
}

fn inject_trace_context(headers: &mut reqwest::header::HeaderMap) {
    global::get_text_map_propagator(|p| {
        p.inject_context(&tracing::Span::current().context(), &mut HeaderInjector(headers))
    });
}
On outgoing calls, add the W3C traceparent header (and tracestate); on incoming requests, extract it and make it the parent of the request span. In Axum and Tower, the tower-http TraceLayer plus an OpenTelemetry extraction layer does this per request; for HTTP clients use reqwest-middleware with a tracing middleware; for message queues put the same headers in message metadata. Without propagation each service has its own disconnected traces.
Metrics without a cardinality explosion
- Labels must have bounded values: route template, method, status class. Never user ids, request ids or raw URLs (each distinct value is a new time series).
- Prefer histograms for latency so percentiles survive aggregation (tail latency).
- Use the RED set per service (rate, errors, duration) and USE for resources (utilization, saturation, errors), plus runtime signals (Tokio metrics).
Sampling and cost
| Strategy | How | Trade-off |
|---|---|---|
| Head sampling | Decide at the root: keep 1 to 10 percent | Cheap; may drop the interesting traces |
| Tail sampling | Collector keeps all errors and slow traces, a sample of the rest | Better data; the collector buffers whole traces |
| Always on for errors | Attach error status; tail rules keep them | Essential for debugging incidents |
Set log levels sensibly (log levels), drop health-check spans, and keep retention proportional to need. Observability bills grow with volume faster than with value.
Checklist
- One
tracingsetup function shared by all services. - Service name, version and environment as resource attributes.
- Request id or trace id in every log line.
- Context propagation on every inbound and outbound boundary.
- A collector with sampling and redaction configured centrally.
- Dashboards and alerts based on the RED metrics, linked to traces.
Pair this with request-level logging in the web layer (request ids in Axum) and an incident process that uses these signals (incident runbook).